
Is India’s Bull Run Really Over? What Has Changed Since 2003
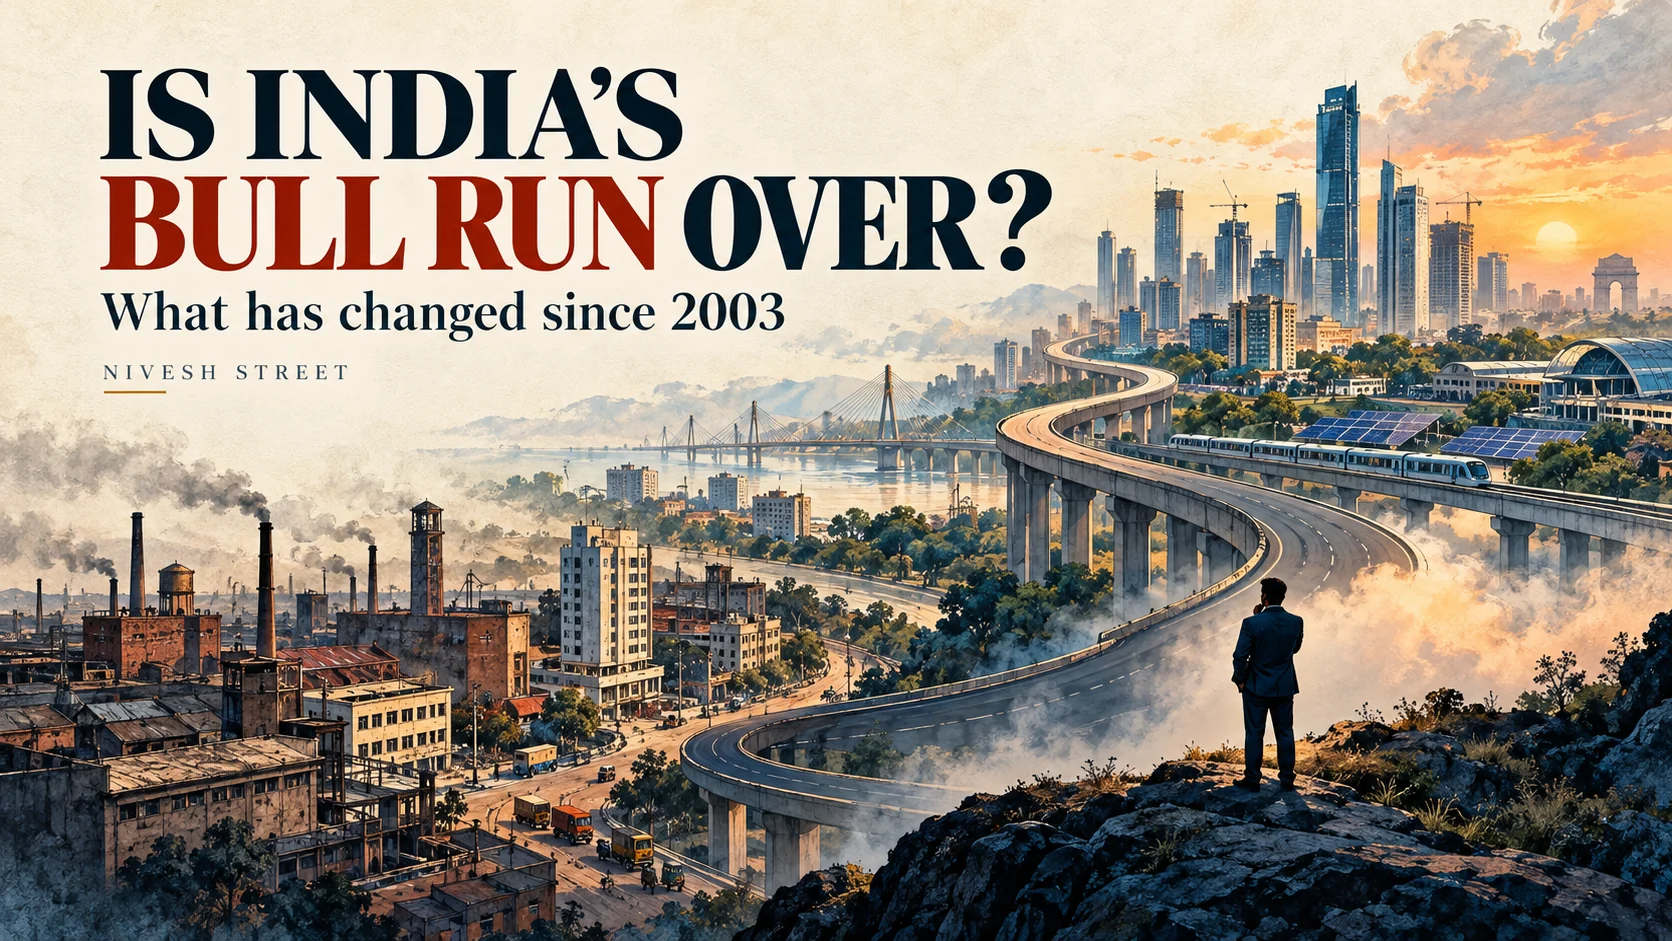
India’s long-term investment case has survived repeated crises. But a stronger economy does not automatically mean stronger stock-market returns.
Nivesh Street | 28 October 2026
When Indian markets fall, investors usually ask how quickly they will recover. After a prolonged period of disappointment, the question becomes more uncomfortable: what if the bull run itself is over?
For investors who trace India’s wealth-creation journey back to 2003, this is more than a question about the next Nifty target. It challenges a belief that has shaped an entire generation: stay invested, buy corrections, and India’s growth will eventually reward you.
The evidence supports a more measured conclusion. India’s long-term investment foundations have not disappeared. But those foundations cannot guarantee a quick recovery, protect every stock, or justify every valuation.
There is also a problem with the premise. India has not experienced one uninterrupted bull market since 2003.
The original rally ended. The economy—and the market’s capacity to create wealth—continued.
The history is less comfortable than the long-term chart suggests
NSE’s historical data shows how dramatically market conditions changed even within this supposedly continuous bull run.
Calendar yearNifty 50 total return2003+76.61%2007+56.80%2008−51.27%2009+77.59%2011−23.81%2015−3.01%2020+16.14%2023+21.30%
Total returns include reinvested dividends. Calendar-year figures can conceal substantial declines within the year.
A market that loses more than half its value in a calendar year has experienced a serious break, regardless of what a twenty-year chart eventually looks like.
The distinction matters. A cyclical bull market is a particular period of rising prices. A secular investment case rests on businesses growing profits and creating shareholder value over many years, through multiple cycles.
The 2003 rally can be over while India’s longer-term investment opportunity remains alive. Equally, a compelling long-term opportunity can coexist with years of disappointing returns.
Why 2003 was such a powerful starting point
The early-2000s recovery had identifiable economic foundations.
The RBI’s 2003–04 Annual Report described an agricultural rebound after drought, strengthening industrial and services activity, improving capacity utilisation and buoyant external demand. Merchandise exports grew by more than 20% in dollar terms for a second consecutive year, while IT-enabled services and business-process outsourcing remained resilient.
India was benefiting from several engines accelerating together. Domestic recovery, export competitiveness and expanding business activity reinforced each other.
That is important because investors sometimes treat the returns that followed as a normal entitlement of Indian equities.
They were the outcome of a particular starting point and a particularly favourable combination of conditions. Today’s investors own a different market, at different prices, facing different opportunities.
The biggest change: domestic investors now supply substantial recurring capital
AMFI reports that monthly mutual-fund SIP contributions increased from ₹3,122 crore in April 2016 to ₹32,490 crore in September 2026—more than tenfold in nominal terms. These are gross SIP contributions across mutual funds, not a measure of net equity buying.
That distinction prevents exaggeration, but the structural change remains significant. Indian markets have a much larger recurring pool of domestic investment capital.
This can help absorb selling and broaden participation. It also changes how households build financial wealth.
However, recurring investment flows are a source of demand, not a guaranteed floor under prices. Redemptions, foreign selling, new share issuance and changing earnings expectations can still overwhelm buying.
A SIP is an investment discipline. It is not market insurance.
The banking system has passed through a major stress-and-repair cycle
The years since 2003 have also included a painful lesson about credit.
Expansion financed by borrowing can create growth initially and bad loans later. A market cannot judge the quality of an investment cycle solely by the number of projects announced or loans sanctioned.
RBI historical data put scheduled commercial banks’ gross non-performing asset ratio at 11.2% in FY2017–18. Its June 2024 Financial Stability Report recorded a decline to 2.8% at end-March 2024. These dated observations illustrate the scale of the subsequent repair; they are not presented as today’s latest readings.
Cleaner bank balance sheets improve the capacity to finance businesses and households. They reduce one important vulnerability compared with the stressed years.
But a lower bad-loan ratio does not prove that every new loan is sound. The next cycle must still be assessed through underwriting quality, fresh defaults and borrowers’ ability to repay.
Investment has changed in both scale and character
Public capital expenditure has become a substantial part of the growth strategy.
The Economic Survey 2025–26 records central government capital expenditure of ₹3.07 lakh crore in FY2019, compared with a budgeted ₹11.21 lakh crore for FY2026. The latter is an allocation, not a claim about final spending. The Survey also describes a broader infrastructure agenda covering logistics, digital systems and clean energy alongside physical transport networks.
For investors, the next question is whether this spending generates productive assets, stronger private investment and sustained cash flows.
A large order book can be encouraging. It becomes shareholder value only when projects are executed profitably and customers pay.
This is where a national growth story must become company-level analysis.
Formalisation has expanded the opportunity—and changed competition
India’s GST taxpayer base expanded from approximately 65 lakh in 2017 to 1.51 crore in 2025, according to a government account of the reform.
Alongside digital infrastructure, this represents a materially different business environment from 2003.
Our interpretation is that greater formalisation can help organised businesses through more transparent transactions, wider distribution and improved access to finance. But the gains are uneven. Compliance costs, competition and execution still matter.
Nor should every gain in a listed company’s market share be mistaken for equally strong growth across the entire economy. A business can prosper partly by taking sales from smaller competitors.
Even “the market” is a different portfolio now
Comparing the Nifty across decades does not mean comparing the same companies with the same weights.
NSE’s October 2025 Market Pulse reported that financials represented 36.5% of the Nifty 50 in September 2025, while information technology accounted for 9.9%.
This changes what drives the benchmark. Credit growth, bank profitability and domestic financial activity carry substantial influence.
It also exposes a common mistake in long-term investing: assuming that because an index eventually recovers, every stock will recover with it.
Index membership and weights evolve. A personal portfolio of yesterday’s favorites may not.
What makes the current debate different?
Recent weakness deserves scrutiny rather than dismissal.
In research published on October 21, 2026, WisdomTree described an eight-week Nifty decline into early October, deteriorating market breadth and persistent foreign selling. It also reported some stabilisation in earnings revisions. This is a mixed picture: genuine market stress alongside signs that the profit outlook may be finding support.
Valuations have also adjusted. An October 24 IANS report, citing Bajaj Asset Management, put the Nifty 50’s forward price-to-earnings multiple at 17.2 times in September 2026, down from 24.8 times in September 2024. These are the cited research provider’s estimates, based on expected earnings.
A lower forward multiple can improve the prospective return equation. But only if the earnings denominator holds up. Forecast cuts can make an apparently cheap market less cheap.
The external environment matters too. The IMF’s October 2026 outlook identifies conflict escalation, renewed trade tensions and fiscal vulnerabilities among downside risks, while highlighting the difficulties facing energy-importing economies outside the technology value chain.
Domestic participation and stronger banks provide resilience. They do not eliminate global shocks.
The most important change may be what investors should expect
Consider a hypothetical company earning ₹100 per share and trading at 30 times earnings: its share price is ₹3,000.
Five years later, earnings have grown at 10% annually to approximately ₹161. But investors now pay only 20 times earnings. The share price is approximately ₹3,221.
The business has increased earnings by about 61%. The share price has gained only about 7%, before dividends.
Nothing in this example requires the business—or its country—to fail. The starting valuation does most of the damage.
This is why “India will grow” cannot, by itself, settle an investment decision. Returns depend on earnings per share, dividends and the valuation investors pay, not just GDP growth.
What would genuinely weaken the long-term case?
A disappointing quarter or a sharp correction would not be enough. More persuasive evidence would include several developments persisting together:
Broad, prolonged weakness in earnings per share and operating cash flow.
A renewed deterioration in bank asset quality and credit availability.
Investment spending that consistently fails to produce adequate returns.
Weak household income growth that limits sustainable consumption.
Valuations that remain demanding despite deteriorating business performance.
Conversely, broader earnings growth, productive private investment and healthy credit quality would strengthen the case for recovery. None would identify the exact market bottom.
Nivesh Street’s assessment is that the evidence does not justify declaring India’s long-term equity opportunity finished. It does justify questioning the assumption that every decline will be brief and every expensive stock will eventually grow into its price.
The bull market that began in 2003 ended long ago. What followed was a succession of recoveries, excesses, crises and new sources of growth.
India can keep progressing while investors earn disappointing returns. The next phase will depend on how much companies earn—and how much investors pay for those earnings.